
How does the 831L Profiling Sonar work?
The 831L Pipe Profiling Sonar is a single-beam mechanical scanning sonar, that rotates 360° to make multiple measurements of the distance from sonar to the wall of the pipe or tunnel. The sonar beam is narrower than in an 2D imaging sonar, as the goal is to capture a narrow profile or point from the pipe. At a 1-meter range, the 831L completes a full 360° scan in just 1.3 seconds.
The sonar will draw a cross section of the pipe that can be used to capture or visualize the internal structure of the pipe, detect defects or measure sediment buildup.
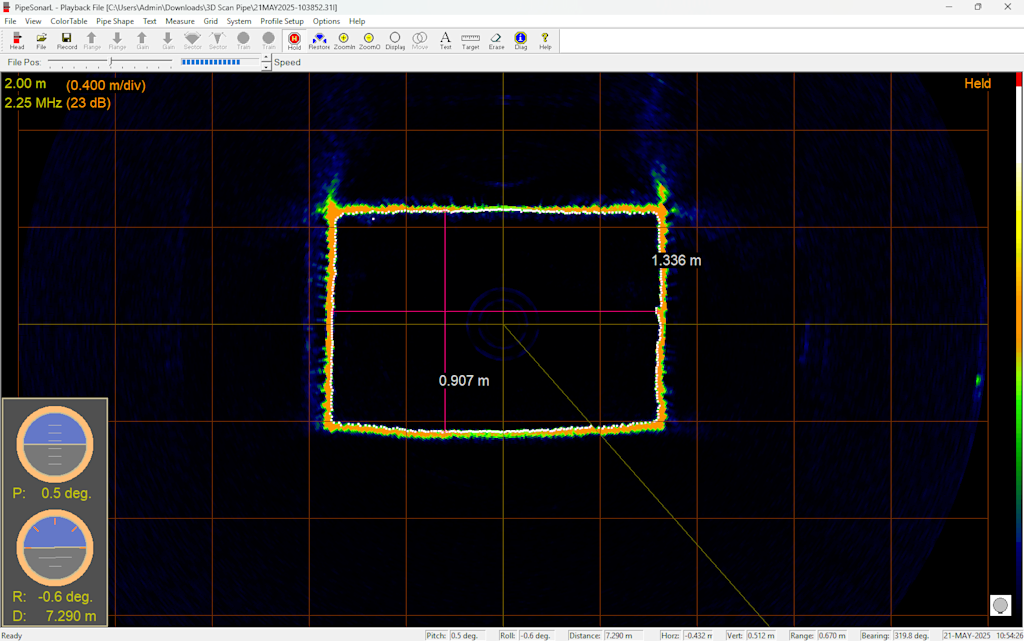
The 831L sonar has an operational range from 0.125 m to 6 m. Due to the compact size of the Blueye X3 and the 831L Pipe Profiling Sonar, you can capture profiles in pipes from 80 cm in diameter, up to 12 m in diameter.
From 2D to 3D
The 831L Pipe Profiling Sonar itself captures 2D points as a series of points from the center of the sonar to the wall of the pipe. If we want to display the data in 3D, we also need data for the Z-axis. The PipeSonarL software used to operate the sonar, has support for receiving external data with information about how far into the pipe you have travelled. Traditionally, this information came from mechanical cable counters that measured how much tether had been deployed.
On the Blueye X3, a DVL (Dopler Velocity Log) measures speed over ground, and can be used as an odometer that measures how far you have travelled. In the Blueye App you can reset this odometer when you want, for instance when entering the pipe you wish to inspect.
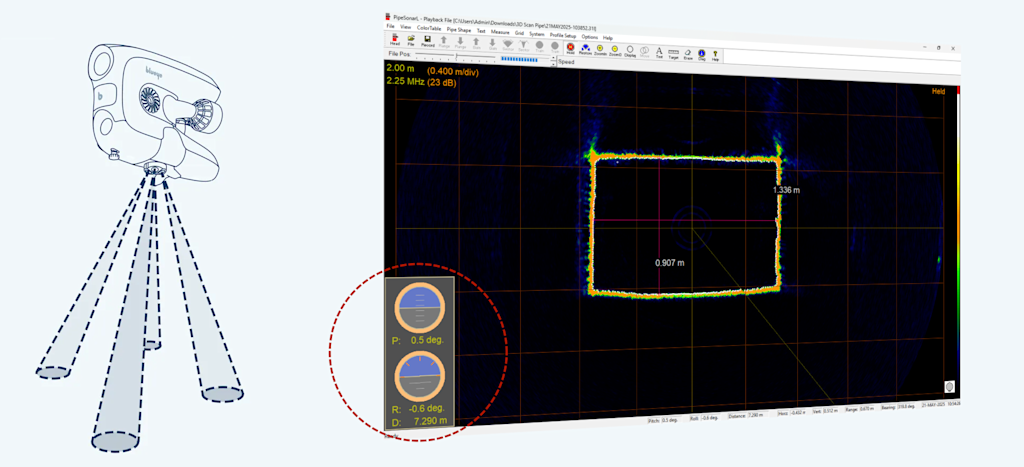
As part of our integration with the 831L Pipe Profiling Sonar we have added code that forwards the distance traveled to the PipeSonarL software. The odometer value from the Blueye X3 DVL becomes visible inside the PipeSonarL software and included in the sonar recordings.
Post processing and analyzing of 3D data in CloudCompare
The PipeSonarL software can output a xyz-file file, which is a time stamped series of 3D points. This file format can be processed, enhanced and visualized in a wide range of software. CloudCompare is a powerful open-source tool for visualizing, cleaning, and analyzing 3D point clouds and meshes.
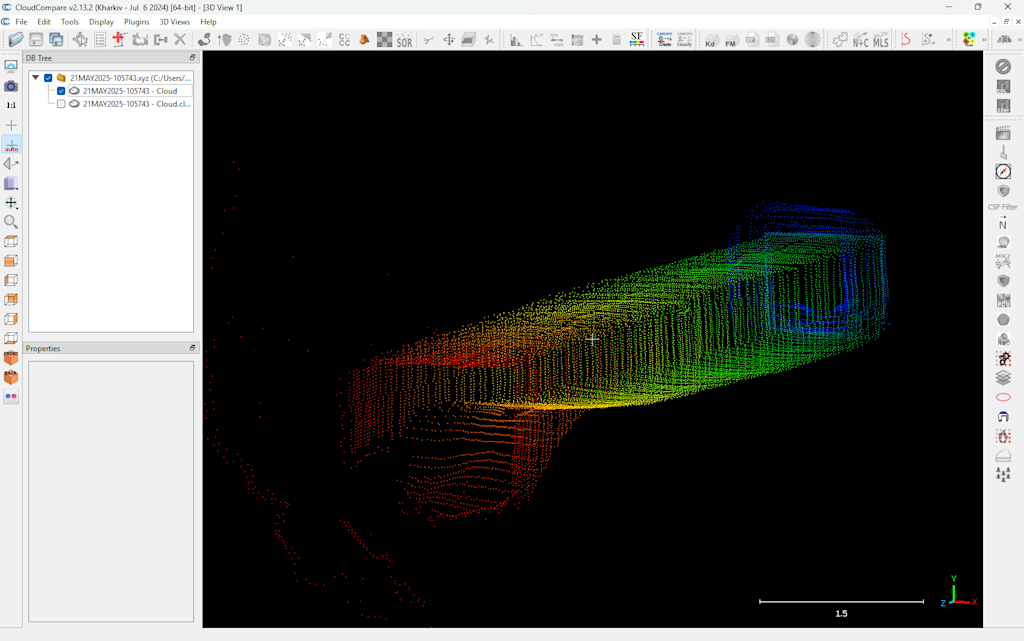
Using CloudCompare we can import the xyz-file and apply filters to clean up the point cloud to remove outliers. Next, we can add a scalar field that is set to the index of the point. This index helps distinguish layers along the scan path, effectively adding a sense of depth or directionality to the point cloud. Color gradients and heat maps can be applied to this field to enhance the visual interpretation of the point cloud.
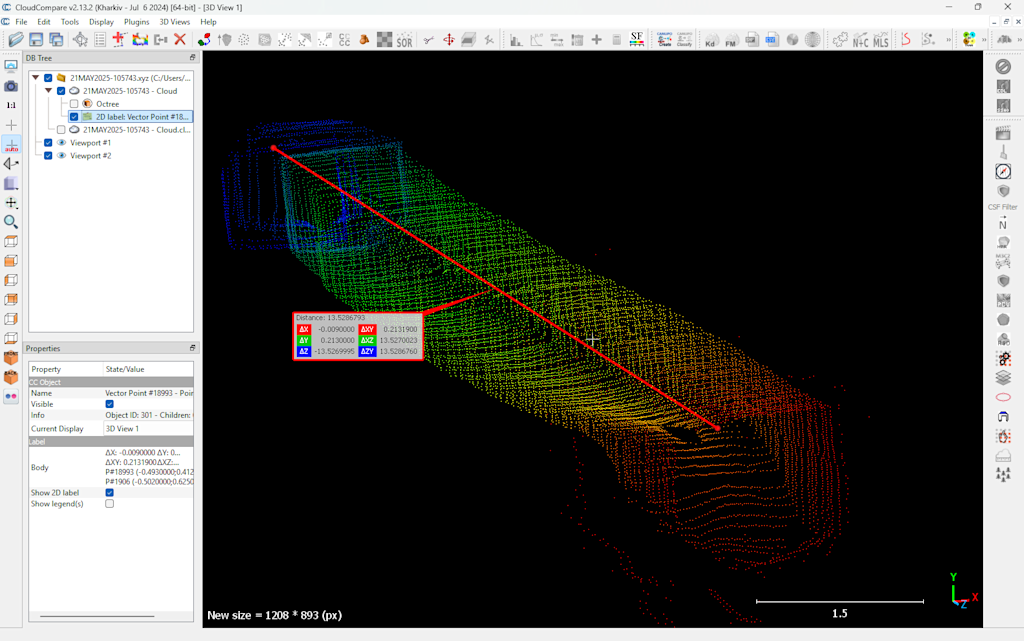
We can measure the distance between points in the 3D point cloud and see that this scan is about 13.5 m in length.
To animate the model, we can save a series of viewpoints and then use the animation plugin to have CloudCompare render a video that is animating between the different viewpoints. The amount of functionality in CloudCompare is way too broad to cover in this article, but thankfully there is a very active user community sharing tips and YouTube videos explaining how to use the software.
Sharing the 3D model online
From CloudCompare we export the model as a PLY (Polygon File Format) that can be uploaded to uploaded to 3D model-sharing platforms like Sketchfab for easy sharing and web-based visualization.
Summary
The Imagenex 831L Pipe Profiling Sonar, combined with the Blueye X3 and its integrated DVL, offers a compact and highly capable solution for underwater pipe and tunnel inspections. Whether you're documenting structural conditions, detecting defects, or assessing sediment buildup, the system enables you to generate accurate 2D and 3D profiles. By exporting this data into tools like CloudCompare and Sketchfab, it's easier than ever to analyze and share detailed visualizations of your underwater assets.
You can learn more about the technical specification of the Imagenex 831L Pipe Profiling Sonar in our product page.